© 2010 Naturesfury.net


How can scientists tell where the earthquake happened?
Seismograms come in handy for locating earthquakes too, and being able to see the P wave and the S wave is important. You learned how P & S waves each shake the ground in different ways as they travel through it. P waves are also faster than S waves, and this fact is what allows us to tell where an earthquake was. To understand how this works, lets compare P and S waves to lightning and thunder. Light travels faster than sound, so during a thunderstorm you will first see the lightning and then you will hear the thunder. If you are close to the lightning, the thunder will boom right after the lightning, but if you are far away from the lightning, you can count several seconds before you hear the thunder. The further you are from the storm, the longer it will take between the lightning and the thunder.
P waves are like the lightning, and S waves are like the thunder. The P waves travel faster and shake the ground where you are first. Then the S waves follow and shake the ground also. If you are close to the earthquake, the P and S wave will come one right after the other, but if you are far away, there will be more time between the two. By looking at the amount of time between the P and S wave on a seismogram recorded on a seismograph, scientists can tell how far away the earthquake was from that location. However, they can’t tell in what direction from the seismograph the earthquake was, only how far away it was. If they draw a circle on a map around the station where the radius of the circle is the determined distance to the earthquake, they know the earthquake lies somewhere on the circle. But where?
Scientists then use a method called triangulation to determine exactly where the earthquake was (figure 2). It is called triangulation because a triangle has three sides, and it takes three seismographs to locate an earthquake. If you draw a circle on a map around three different seismographs where the radius of each is the distance from that station to the earthquake, the intersection of those three circles is the epicenter!
Click Image To Enlarge
Figure 2
Can scientists predict earthquakes?
No, and it is unlikely they will ever be able to predict them. Scientists have tried many different ways of predicting earthquakes, but none have been successful. On any particular fault, scientists know there will be another earthquake sometime in the future, but they have no way of telling when it will happen.
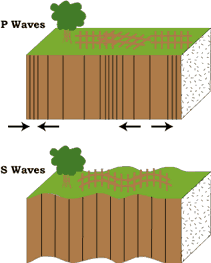
Figure 1
USGS Image
Earthquakes are measured using the Richter Scale, which is a logarithmic scale ranging from 0-9. (Logarithmic means that with each increase of one on the Richter scale, there is a tenfold increase in energy.) The scale is as follows:
0.1 - 2.0 : Micro : Not felt.
2.0 - 2.9 : Minor : Not felt, but recorded.
3.0 - 3.9 : Minor : Felt, but rarely cuse damage.
4.0 - 4.9 : Light : Noticable shaking of items, damage unlikely.
5.0 - 5.9 : Moderate : Damage to poorly constructed buildings, unlikely damage to well designed buildings.
6.0 - 6.9 : Strong : Destructive for up to 100 miles across populated areas.
7.0 - 7.9 : Major : Serious damage over large areas.
8.0 - 8.9 : Great : Serious damage over areas of several hundred miles.
9.0 - 9.9 : Great : Devastating damage in areas thousands of miles across.
10.0+ : Great : Yet to be recorded.